
The ONS have released the latest Labour Market Overview covering the months May 2021 – July 2021, there is additional data that covers August.
What Does This Mean For Youth Employment?
Headlines for young people
This data explores what this looks like for young people (16-24 years old).
In work:
The employment rate is 52.2%, up 1.9 percentage points (ppts) on the previous quarter, down 3.3 ppts since March 2020 (pre-pandemic).
- There are 3.5 million in employment, up 120,000 on the quarter, but still down 275,000 since March 2020.
- PAYE real time data shows that between August 2020 and August 2021, 380,000 of the increase in payrolled employees are aged younger than 25 years.
Unemployment
The unemployment rate is 12.9%, down 0.6 ppt on the previous quarter, up 1.2 ppts since March 2020.
- 525,000 are unemployed; down 10,000 on the previous quarter and up 18,000, since March 2020.
- 77.3% of those are aged 18-24, 22.7% are aged 16-17 years old.
The claimant count in August 2021 stands at 390,000; this is a decrease of 12,000 on the month (-3.0%) but up by 120,000 since May 2020 (76.9%).
Economically inactive
The economic inactivity rate for young people is 40.1%, down 1.7 ppts on the previous quarter and 2.9 ppt since March 2020.
- There are 2.7 million economically inactive young people; down 125,000 on the previous quarter, up 165,000 since March 2020.
- Estimates for young people not in employment, full-time education, and training (NEET) stand at 850,000.
Headlines for all ages
In work
The employment rate is 75.2%, an increase of 0.5 ppts on the previous quarter, but still 0.4 ppts lower than before the pandemic.
- There are 32.35 million people in employment, up by 180,000 on the previous quarter, but down by 200,000 on the year.
- The majority of the rise in employment are part-time workers who suffered large decreases during the pandemic.
PAYE data shows 29.1 million are in paid employment, up by 240,000 (or 0.8%) on the previous month, and 835,000 (or 3%) over the last 12 months.
- All regions except London, Scotland and the South East are now above pre-coronavirus levels.
- ‘Wholesale and retail’, ‘Health and social work’ and ‘Education’ (the three largest sectors in the UK) account for 40% of the UK employees.
- When compared with the same months last year, the sectors with the strongest growth are:
- ‘Administrative and support services’ : 248,854
- ‘Health and social work’ : 157,644
- ‘Education’ : 139,300
- When compared with the same months last year, the sectors struggling are:
- ‘Transport and storage’ : -18,560
- ‘Wholesale and retail trade and repair of motor vehicles’ : -10,077
- ‘Manufacturing’ : -8,060
- See graph 3 for all sectors
Total actual weekly hours worked in the UK increased by 43.2 million hours from the previous quarter, to 1.01 billion hours. However, this is still 45.4 million hours below pre-pandemic levels (December 2019 to February 2020).
The redundancy rate is 3.4 per thousand, decreasing by 0.6 per thousand on the quarter. At its peak in September to November 2020, the redundancy rate stood at 14.2 per thousand.
- The redundancy rate is similar to pre-pandemic levels.
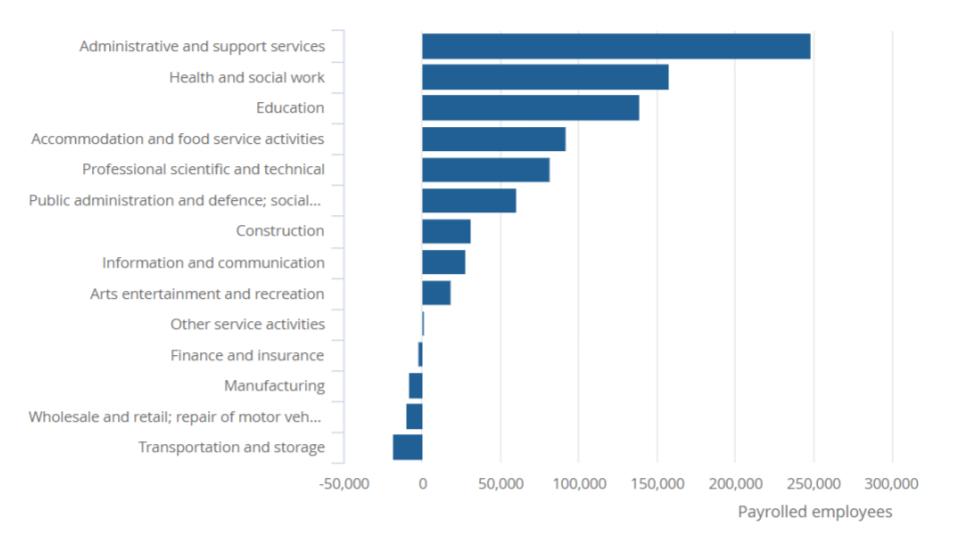 Graph 3 – Payrolled employees by sector changed between August 2020 – 2021. Source: HM Revenue and Customs – Pay As You Earn Real Time Information.
Unemployment
The unemployment rate is 4.6%, 0.3 ppts lower than the previous quarter, 0.3 ppts higher than before the pandemic.
- 1.55 million people are unemployed, a fall of 86,000 on the quarter but up 81,000 on the year.
- Unemployment had been falling since late 2012 up until the pandemic, rising across 2020 and has been falling since the end of 2020.
- The fall in unemployment is largely driven by a fall in those spending up to 12 months unemployed, however those unemployed for 12 months or more (long term unemployment) continues to rise.
The claimant count stands at 2.2 million, a decrease of 60,000 (-2.6%) on the previous month, still up by 460,000 since May 2020 (83%).
The number of job vacancies in August 2021 was 1.03 million, a record high. Up 35.2% on the quarter and 31.7% above the pre-pandemic level.
- This is the first time vacancies have surpassed a million since record began, all sectors have seen an increase in the number of vacancies in the quarter (see graph 4).
- The ‘Transport and storage’ sector saw an increase of 76.3%, whilst ‘Accommodation and food services’ saw an increase of 75.4%.
- ‘Electricity gas steam and air conditioning supply’ (1.8%) and ‘Construction’ (12.3%) sectors saw the smallest growth.
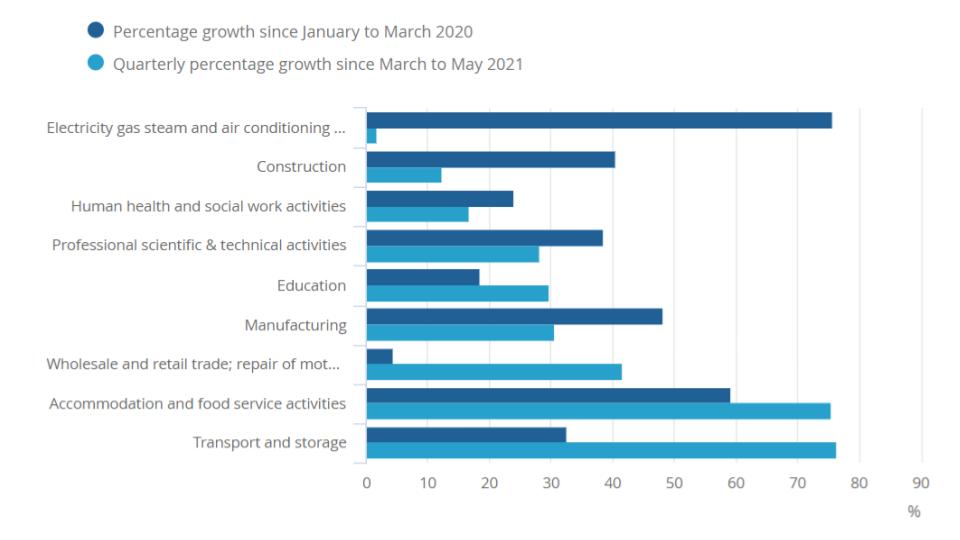 Graph 4 – Vacancies by sector. The dark blue bar shows percentage growth since May 2020 (dark blue bar) and the light blue bar shows percentage growth since July 2021. Source: Office for National Statistics – Vacancy Survey.
Economically inactive
The economic inactivity rate stands at 21.1%, 0.3 ppts lower than the previous quarter and 0.2 ppts higher than before the pandemic.
- Economic inactivity is still largely driven by students and those reporting ‘other’ as their reason.
- The number of economically inactive people who stated they wanted a job has fallen to a record low.
Our Commentary
The labour market figures continue to show promising signs of recovery; headline figures suggest employment is rising, unemployment and economic inactivity is falling, vacancies continue to rise and redundancies have returned to pre-pandemic levels.
While these headline figures look good for all age groups, it must be noted that unemployment is falling faster than employment is rising, meaning this is driven by those economically inactive that are not looking for work. Long term unemployment continues to be a concern as the figures show today that those unemployed for 12 months+ continues to rise.
For young people, the employment rate has risen by 1.9 ppts but the unemployment rate has fallen by 0.6 ppts – this means employment is rising three times faster than unemployment is falling. Economic inactivity has fallen within the age group slightly, ‘Student’ is still the highest given reason for economic inactivity.
As we continue to recover and anticipate a ‘Saving Review’ in October, we must be aware that the job is not yet done for young people. There were issues in the labour market before the pandemic, and whilst Government support has been vital in preventing a jobs crisis for young people, the most vulnerable and furthest away from the labour market are at risk of being left behind.With the end of furlough, Kickstart winding up and the apprenticeship incentive finishing soon, now is the time to consider what Opportunity Guarantee there is for young people as we head into 2022.