
The ONS have released the latest Labour Market Overview covering the months June 2021 – August 2021, there is additional data that covers September.
What Does This Mean For Youth Employment?
Headlines for young people aged 16 – 24
In work:
The employment rate is 52.7%, up 1.9 percentage points (ppts) on the previous quarter, down 2.9 ppts since March 2020 (pre-pandemic).
There are 3.6 million in employment, up 120,000 on the quarter, but still down 245,000 since March 2020.
Unemployment
The unemployment rate is 12.2%, down 1.3 ppt on the previous quarter, up 0.4 ppts since March 2020.
- 500,000 are unemployed; down 40,000 on the previous quarter and up 18,000, since March 2020.
- 79.1% of those are aged 18-24, 20.9% are aged 16-17 years old.
- The claimant count in September 2021 stands at 370,000; this is a decrease of 12,000 on the month (-3.1%) but up by 140,000 since March 2020 (78.1%).
Economically inactive
The economic inactivity rate for young people is 39.9%, down 1.3 ppts on the previous quarter and 2.9 ppt since March 2020.
- There are 2.7 million economically inactive young people; down 90,000 on the previous quarter, up 170,000 since March 2020.
- Estimates for young people not in employment, full-time education, and training (NEET) stand at 850,000, largely unchanged on the previous quarter and down 150,000 since March 2020.
Headlines for all ages
In work
The employment rate is 75.3%, an increase of 0.5 ppts on the previous quarter, but 0.1 ppts lower than before the pandemic.
- There are 32.4 million people in employment, up by 240,000 on the previous quarter, but down by 660,000 since March 2020.
- The majority of the rise in employment are part-time workers who suffered large decreases during the pandemic.
PAYE data shows 29.2 million are in paid employment.
- All regions except London, Scotland are the only regions not above pre-coronavirus levels. However growth has not been even throughout the regions with the South East seeing a rise of 4.2 million payrolled employees compared to 770,000 in Northern Ireland.
- ‘Wholesale and retail’, ‘Health and social work’ and ‘Education’ (the three largest sectors in the UK) account for 40% of the UK employees. Administrative and support services, manufacturing, professional, scientific and technical, and accommodation and food service activities account for a further 30%.
- When compared with the same months last year, the sectors with the strongest growth are:
- ‘Administrative and support services’ : 290,00
- ‘Health and social work’ : 180,000
- ‘Accommodation and food services’ : 130,000
- When compared with the same months last year, the sectors struggling are:
- ‘Transport and storage’ : -15,000
- ‘Finance and insurance’ : -7,000
- ‘Other service activities’ : +8,060
- See graph 1 for all sectors
Total actual weekly hours worked in the UK increased by 40 million hours from the previous quarter, to 1.02 billion hours. However, this is still 30.9 million hours below pre-pandemic levels (March 2020).
The redundancy rate is 3.6 per thousand, decreasing by 0.2 per thousand on the quarter. At its peak in September to November 2020, the redundancy rate stood at 14.2 per thousand.
- The redundancy rate is similar to pre-pandemic levels.
![]()
Graph 1 – Payrolled employees by sector changed between August 2020 – 2021. Source: HM Revenue and Customs – Pay As You Earn Real Time Information.
Unemployment
The unemployment rate is 4.5%, 0.4 ppts lower than the previous quarter, 0.5 ppts higher than before the pandemic.
- 1.5 million people are unemployed, a fall of 130,000 on the quarter but up 150,000 since March 2020..
- The fall in unemployment is largely driven by a fall in those spending up to 12 months unemployed. The rise in those unemployed for 12 months or more (long term unemployment) has largely flattened compared to the previous quarter.
The claimant count stands at 2.1 million, a decrease of 50,000 (-2.4%) on the previous month, still up by 870,000 since May 2020 (69.3%).
The number of job vacancies in August 2021 was 1.1 million, a new record high. Up 340,000 (or 44% on the quarter and 290,000 (or 36%) above the pre-pandemic level.
- This is the second consecutive month vacancies have surpassed a million. See graph 2 for a breakdown by industry.
- Quarterly percentage changes in vacancies by sector
- Largest growing are ‘Transport and storage’ (56%), ‘Construction’ (45%), ‘Wholesale and retail trade; repair of motor vehicles/cycles’ (32%) and ‘Manufacturing’ (32%).
- Struggling sectors include Human health and social work activities’ (12%), ‘Education’ (22%) and ‘Accommodation and food services’ (23%).
- Percentage change in vacancies by sector since March 2020:
- The largest growth was seen within the ‘Construction’ (65%), ‘Manufacturing’ (64%), ‘Administrative and support service activities’ (63%) and ‘Accommodation and food service activities’ (59%) sectors.
- Struggling sectors include ‘Wholesale and retail trade; repair of motor vehicles/cycles’ (11%), ‘Education’ (22%) and ‘Human health and social work activities’ (27%).
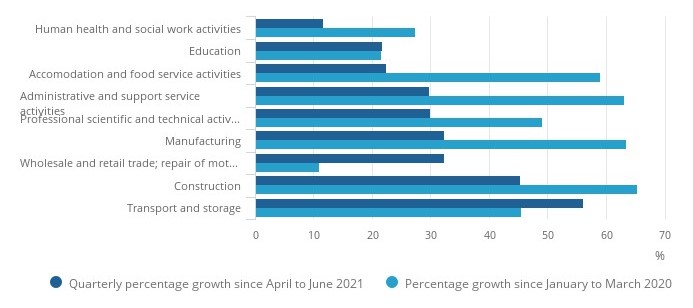
Graph 2 – Vacancies by sector. The dark blue bar shows the change on the quarter (dark blue bar) and the light blue bar shows the change since March 2020. Source: Office for National Statistics – Vacancy Survey.
Economically inactive
The economic inactivity rate stands at 21.1%, 0.2 ppts lower than the previous quarter and 0.9 ppts higher than before the pandemic.
- 8.7 million people are economically inactive, down 90,000 on the quarter but up 350,000 since March 2020.
- Economic inactivity had been largely driven by those who are ‘students’ or for ‘other reasons’, both are now decreasing.
- The number of economically inactive people who stated they wanted a job has fallen to a new record low.
Our Commentary
Today’s labour market data continue to show positive movements in employment and unemployment rates. For young people in particular, employment has risen significantly whilst unemployment and economic inactivity continue to fall. Whilst we celebrate the good shifts we have to recognise that pre-pandemic levels of youth employment and unemployment for young people were still too, high particularly for those most disadvantaged – we have plenty of work still to do.
We continue to hear ongoing employer fears around the vacancy and skills crisis they are facing, we have to do more to address the mismatch and disparity between employers and those who can and want to work. In light of this year’s Youth Voice Census findings around the barriers and expectations of work young people have our Youth Friendly Employer Community and drive to promote quality work has never been more important.