
The ONS have released the latest Labour Market Overview covering the months March 2021 – May 2021, there is additional data that covers June.
What Does This Mean For Youth Employment?
Headlines for young people
This data explores what this looks like for young people (16-24 years old). Graph 1 compares employment, unemployment and inactivity rates discussed below.
In work:
- There are 3,4571,138 in employment, up 56,686 on the quarter but still down 363,159 since March 2020 (pre-pandemic).
- The employment rate is 50.8%, up 0.9 percentage points (ppts) on the previous quarter, down 4.7 ppts since March 2020.
- PAYE data shows that between June 2020 and June 2021, there was a 101,000 increase in payrolled employees under 25 years olds. Under 18’s accounted for 25,290, 18-24 year olds account for 75,989.
- Over the course of the pandemic growth fell more sharply in younger age groups, but has risen more recently (see graph 1).
Unemployment
- 538,791 are unemployed; down 41,381 on the previous quarter but up 32,313 since March 2020.
- The unemployment rate is 13.5%, down 1.1 ppt on the previous quarter, up 1.8 ppts since March 2020.
- The claimant count in June 2021 stands at 441,246; this is a decrease of 22,200 on the month (4.8%) but up by 206,246 since March 2020 (87.6%).
- The fall in unemployment rate is being driven by those spending up to 6 months unemployed finding work and will generally be those who were closest to the labour market. This means more vulnerable people, young people and those over 55 years old are more likely to be in the 6-12 months or 12 months+ categories and this is where we see unemployment levels continue to rise. The number of young people in these categories have almost doubled since March 2020.
Economic inactivity
- There are 2,805,313 economically inactive young people; down 29,609 on the previous quarter, up 247,060 since March 2020.
- The economic inactivity rate for young people is 41.2%, down 0.4 ppts on the previous quarter and 4.0 ppt since March 2020.
- Estimates for young people not in employment, full-time education, and training (NEET) stand at 891,923.
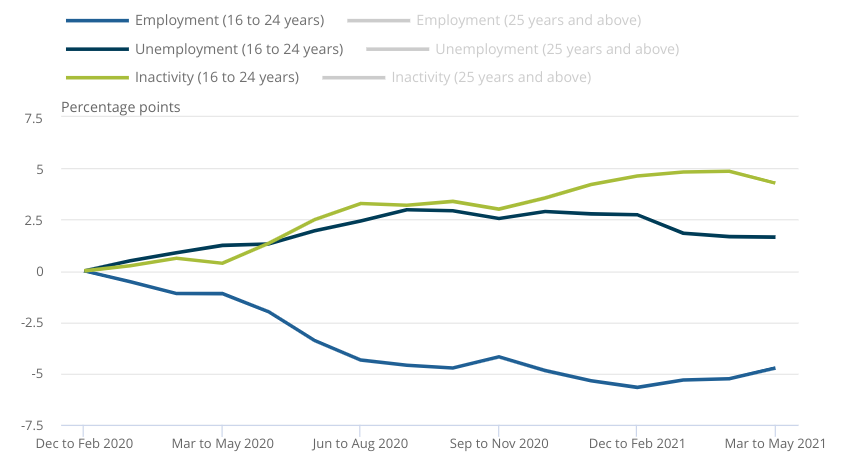
Graph 1 – Employment, unemployment and economic inactivity rates for young people. Source: Office for National Statistics – Labour Force Survey.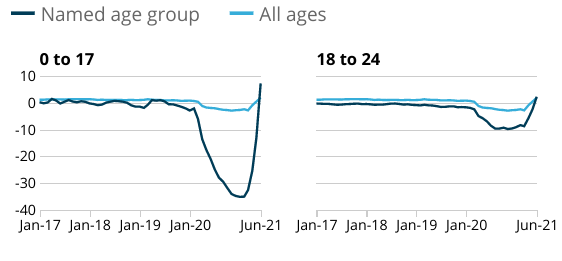 Graph 2 – Payrolled employees by age. Source: HM Revenue and Customs – Pay As You Earn Real Time Information.
Headlines for all ages
In work
- The employment rate is 74.8%, an increase of 0.1 ppts on the previous quarter, 1.8 ppts lower than before the pandemic.
- PAYE data shows 28.9 million are in payrolled employment, up 356,000 on last month but still down 206,000 since March 2020.
- Some regions are now above pre-pandemic levels;North East, North West, East Midlands, Northern Ireland.
- The three most affected sectors are showing signs of recovering; accommodation and food services increased by 94,000 employees, wholesale and retail by 29,000, arts and entertainment by 24,000.
- The total actual weekly hours worked in the UK increased by 23.3 million hours from the previous quarter, to 981.4 million hours. However, this is still 6.7% below pre-pandemic levels.
- The redundancy rate appears to have settled back at pre pandemic levels. The redundancy rate is 3.8 per thousand, decreasing by 3.8 on the quarter. At its peak in September to November 2020, the redundancy rate stood at 14.2 per thousand.
Unemployment
- The unemployment rate is 4.8%, 0.2 ppts lower than the previous quarter, 0.9 percentage points higher than before the pandemic. This is largely driven by a fall in short term unemployment, whilst medium and long term unemployment continues to rise (see graph 3).
- The claimant count stands at 2,321,082, a decrease of 114,800 (-4.7%) on the previous month, still up 1,073,897 (+86.1%).
- There are currently 862,000 vacancies, 9% (77,500) above its pre-pandemic level.
- Arts, entertainment and recreation (330.4%), and food and accommodation (256.6%) show the strongest recovery on the quarter, however the latter is showing signs of skill shortages as they struggle to fill positions.
- Public administration and defence are still down 25.2% on pre-pandemic levels.
- Graph 4 breaks this down by industry.
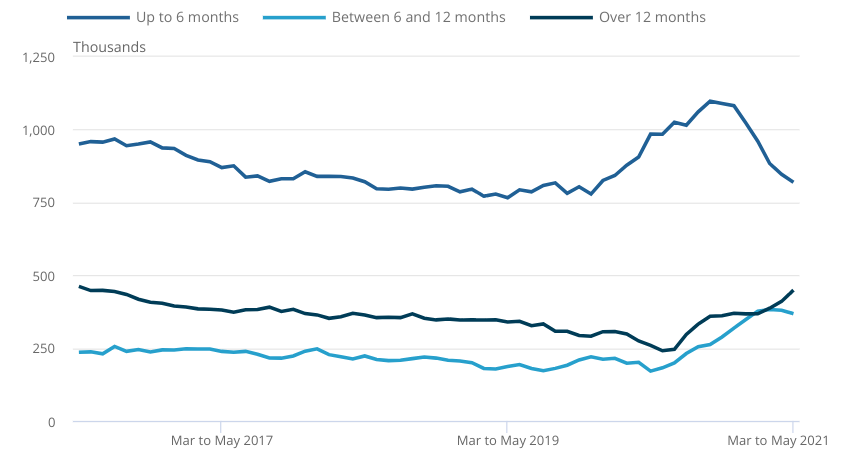 Graph 3 – Whilst short-term unemployment continues to fall, we see long-term unemployment creeping up, the number of people spending over 12 months unemployed is rising faster than 6-12 months spent unemployed. Source: Office for National Statistics – Labour Force Survey.
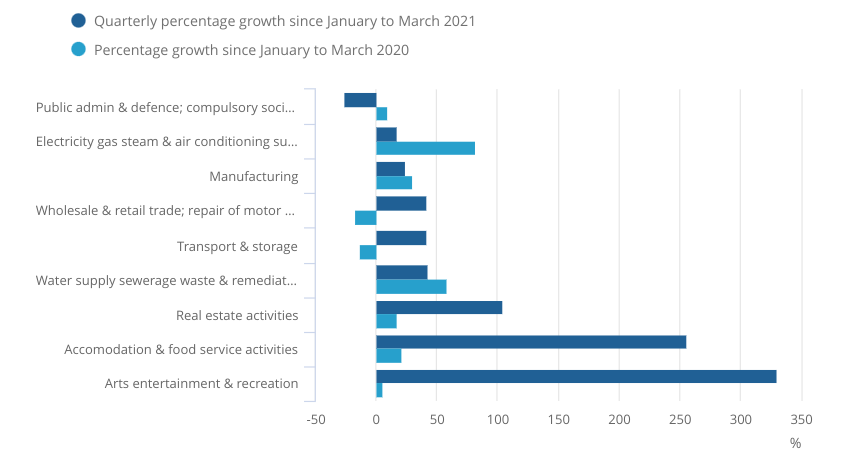
Graph 4 – Arts, entertainment and recreation, and food and accommodation are showing the strongest signs of growth on the quarter. Public admin and defence, and manufacturing struggle compared to the previous quarter. Transport and storage, and wholesale and retail trade struggle compared to pre-pandemic levels. Source: Office for National Statistics – Labour Force Survey.
Economic inactivity
- The economic inactivity rate stands at 21.3%, 0.1 ppts on the previous quarter and 1.1 ppts higher than before the pandemic.
- Economic inactivity is still largely driven by students, accounting for just under 30% the total number of economically inactive working age people. The second largest reason given was that people were looking after homes or relatives. Whilst the former is easing off, the latter showed a slight increase.
Quote from Youth Employment UK
“Young people are still the hardest hit group and still need support. A recovering labour market does not mean it is time to withdraw employment support but rather is the time for further investment in young people’s, and the country’s, future. They are the future workforce and could be exposed to the scarring effects of unemployment during economic turmoil. We continue to work with the Government and other partners to ensure that young people’s voices are heard and that youth employment policies meet their real needs.”