
The ONS have released the latest Labour Market Overview covering the months April 2021 – June 2021, there is additional data that covers July.
What Does This Mean For Youth Employment?
Headlines for young people
This data explores what this looks like for young people (16-24 years old).
In work:
- The employment rate is 51.7%, up 1.4 percentage points (ppts) on the previous quarter, down 3.8 ppts since March 2020 (pre-pandemic).
- There are 3,512,921 in employment, up 88,800 on the quarter, but still down 307,376 since March 2020.
- PAYE real time data shows that between July 2020-21, 247,000 of the increase in payrolled employees are aged younger than 25 years (see graph 1); 91,085 are under 18 years old and 156,079 are aged 18-24.
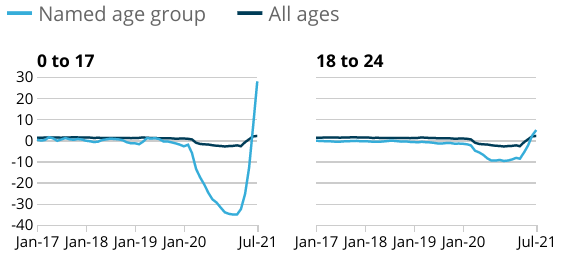
Graph 1 – Payrolled employees by age, January 2017 to July 2021. Young people were more likely to fall out of employment but this has risen recently. Source: HM Revenue and Customs – Pay As You Earn Real Time Information.
Unemployment
- 529,603 are unemployed; down 12,,683 on the previous quarter and up 23,124 since March 2020.
- 77% of those are aged 18-24, 33% are aged 16-17 years old.
- The unemployment rate is 13.1%, down 0.6 ppt on the previous quarter, up 1.4 ppts since March 2020.
- The claimant count in July 2021 stands at 412,105; this is a decrease of 15,043 on the month (-3.5%) but up by 177,080 since March 2020 (75.4%).
Economically inactive
- There are 2,805,313 economically inactive young people; up 94,426 on the previous quarter, up 194,518 since March 2020.
- Students still account for 2,481,330 of the total number of economically inactive working age people.
- The economic inactivity rate for young people is 40.5%, down 1.3 ppts in the previous quarter and 3.4 ppt since March 2020.
- Estimates for young people not in employment, full-time education, and training (NEET) stand at 852,488.
Headlines for all ages
In work
- The employment rate is 75.1%, an increase of 0.3 ppts on the previous quarter, 1.5 ppts lower than before the pandemic.
- PAYE data shows 28.9 million are in payrolled employment, up 182,000 (0.6%) on the previous months, and 576,000 over the last 12 months.
- Some regions are now above pre-pandemic levels; North East, North West, East Midlands, Northern Ireland.
- Some sectors are still struggling when compared to July 2020 (see graph 2):
- Wholesale and retail trade and repair of motor vehicles -50,029
- Manufacturing -32,955
- Storage and transport -14,710
- Arts entertainment and recreation -14,358
- Total actual weekly hours worked in the UK increased by 50.9 million hours from the previous quarter, to 1.00 billion hours. However, this is still 4.8% below pre-pandemic levels (December 2019 to February 2020).
- The redundancy rate appears to have settled back at pre pandemic levels. The redundancy rate is 3.8 per thousand, decreasing by 3.8 on the quarter. At its peak in September to November 2020, the redundancy rate stood at 14.2 per thousand.
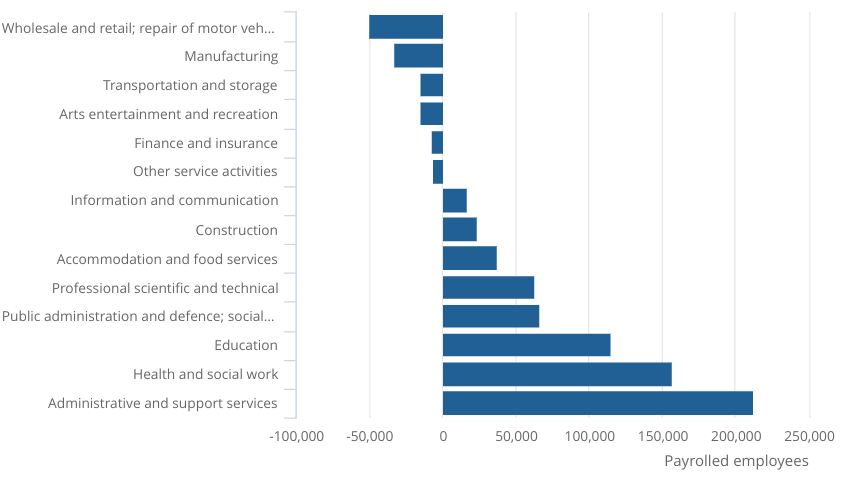
Graph 2 – Payrolled employees by sector, number of employees change between July 2020 – 2021. Source: HM Revenue and Customs – Pay As You Earn Real Time Information.
Unemployment
- The unemployment rate is 4.7%, 0.3 ppts lower than the previous quarter, 1.5 percentage points higher than before the pandemic. This is largely driven by a fall in short term unemployment, whilst medium and long term unemployment continues to rise.
- The claimant count stands at 2,292.992, a decrease of 7,790 (-0.3%) on the previous month, still up 1,045,300 (+83.8%).
- The number of job vacancies in May to July 2021 was 953,000, a record high. Up 43.8% on the quarter and 21.4% above the pre-pandemic level.
- Wholesale and retail trade and repair of motor vehicles is still below pre-pandemic levels.
- Fastest quarterly growth: arts, entertainment and recreation, which grew by 267.1% / accommodation and food service activities (163.7%)
Economically inactive
- The economic inactivity rate stands at 21.3%, 0.2 ppts on the previous quarter and 0.9 ppts higher than before the pandemic.
- Economic inactivity is still largely driven by students (2481,330) and the long-term sick (2,125,836).
- Figure 1 explores how employment, unemployment and economically inactive people flow through each category.
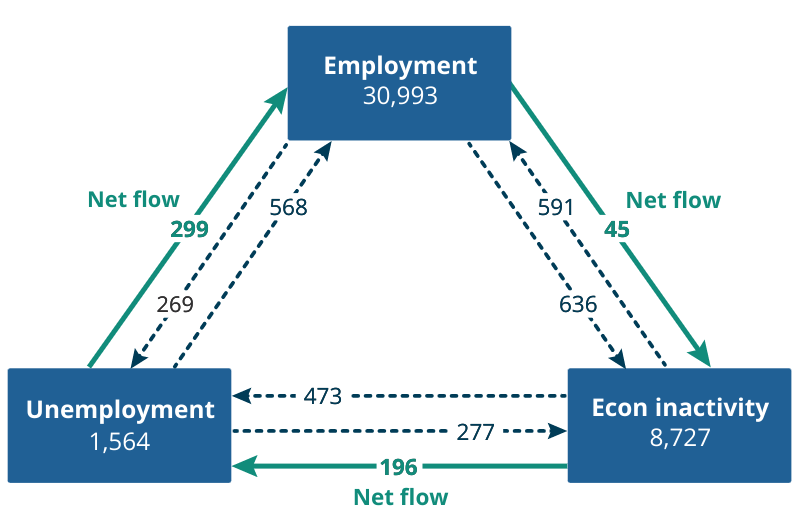
Figure 1 – The flow of people (in thousands) between employment, unemployment and economic inactivity. The flow from unemployment to employment between April – June is a record. Source: Office for National Statistics – Labour Force Survey.
Our Commentary
Today’s labour market data shows encouraging signs of recovery, as expected the opening up of the country has given businesses confidence to start recruiting again.
These shoots of positivity are much needed and welcome but we know that young people can not afford for us to take our foot off of the pedal. They are still almost three times as likely to be unemployed than the all age group with long term unemployment being of particular concern.
Quality opportunities to work, train and study
As we continue in our post-Covid-19 recovery, we must be aware that young people are more likely to be exposed to low quality work. Much more needs to be done to ensure those young people moving back into employment are able to do so in meaningful work. We are pleased to be chairing the Quality of Work subgroup of the Youth Employment Group to ensure that this important topic is explored.